
Behind the Headlines: How the Leaders Really Performed
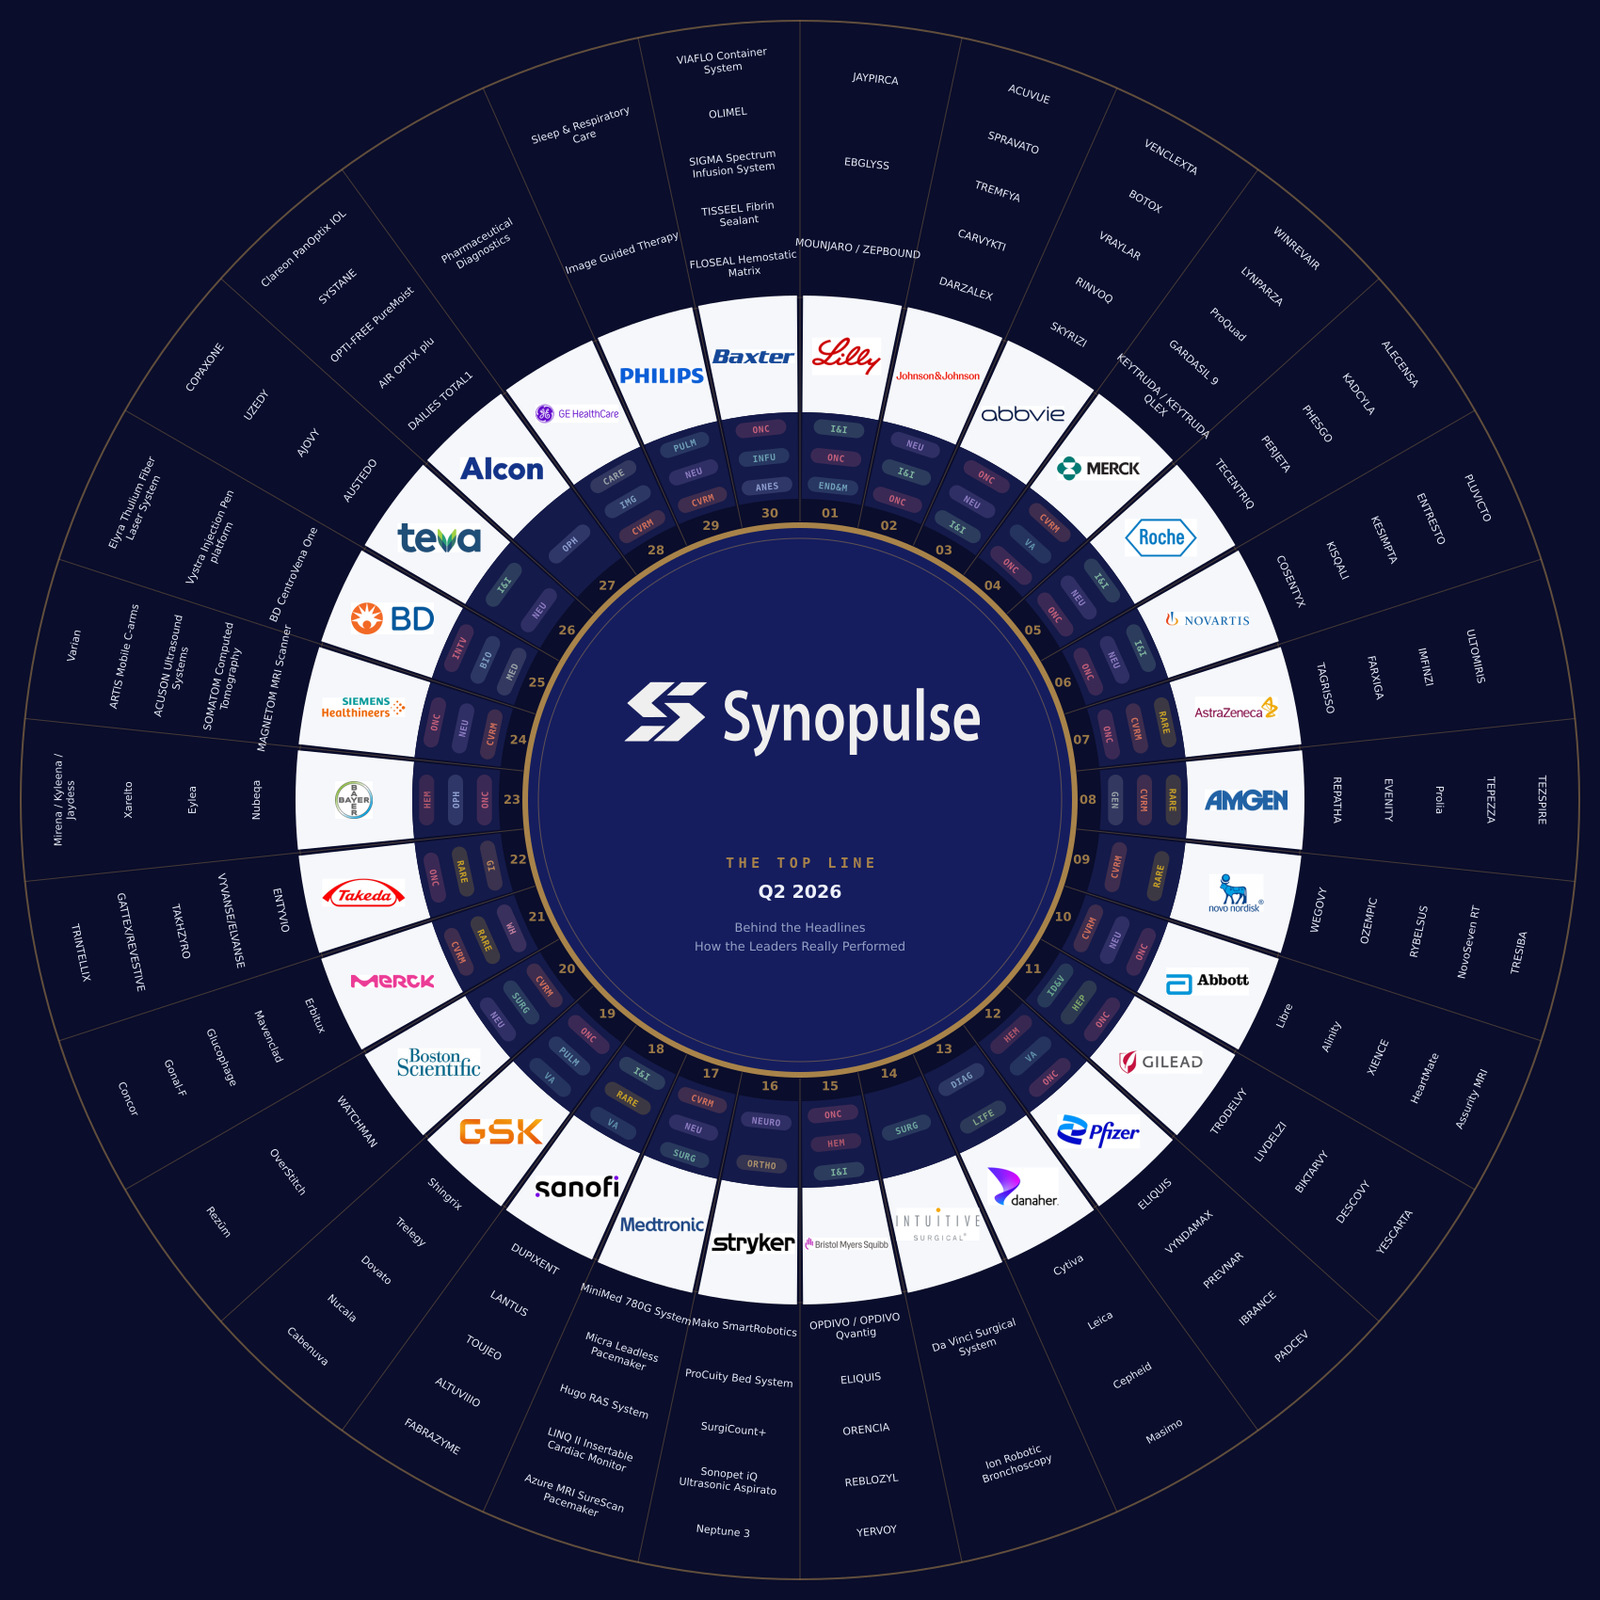
Thirty companies, one quarter. Read together rather than one at a time, the quarter divides along four lines, and none of them is visible in a headline growth rate.
The first is currency, which decided the reported number in opposite directions. Roche’s business grew 6 percent at constant rates and the Swiss franc turned that into a 2 percent decline. Takeda’s shrank 0.5 percent and the yen turned it into 10.2 percent growth. Alongside them, three imaging and device majors reported margins lifted by United States tariff refunds, and Philips put a figure on it: 4.2 points of a 4.0 point margin gain.
The second is succession, and this is the quarter several handovers crossed. AbbVie’s Skyrizi added more revenue in three months than Humira has left to sell. Teva’s AUSTEDO overtook the entire United States generics business the company was built on. MSD’s Keytruda went backwards and its own subcutaneous version covered the gap. At Johnson & Johnson, Oncology grew by more than STELARA lost; at Novartis, the same test failed by $14 million.
The third is concentration. Dupixent is 44 percent of Sanofi and four fifths of its growth. HIV is 75 percent of Gilead’s product sales. Keytruda and its successor together are half of MSD. The fourth is what the statutory accounts hide: Gilead booked an $11.2 billion charge against $7.8 billion of quarterly revenue, and GSK’s total operating profit fell 76 percent on a single impairment while its core measure rose 6 percent.
Entries are numbered by market capitalisation at 30 June 2026, which sets the reading order and nothing else. Conglomerate entries cover the healthcare and life science business only, and that scope is stated on every card.
Build status: 30 entries complete, 0 awaiting data. Every figure on a completed card is taken from the company’s own results release. No figure is estimated, and any measure a company did not disclose is shown as not stated rather than filled.
 Beat · sales up, EPS range cut
Revenue grew 48 percent and the top of the earnings range still came down
Lilly added $7,416 million of revenue in a single quarter, taking sales to $22,974 million against $15,558 million a year earlier. Two products did almost all of it. Mounjaro reached $9,943 million, up 91 percent, and Zepbound $4,928 million, up 46 percent. Together they are $14,871 million, which is 64.7 percent of everything the company sold.
Then the guidance moved in two directions at once. Lilly raised the revenue range from $82 to $85 billion up to $85 to $87 billion, and cut the top of the earnings per share range from $37.00 to $36.50. The reason sits in one line of the income statement: acquired in-process research and development of $2,776 million against $154 million a year ago, worth $3.03 a share.
The buying explains the charge. Lilly signed a development and commercialisation deal with Abbisko worth up to $1,900 million, took BioArctic’s neurodegeneration programme for $30 million upfront against $800 million in total, bought Sangamo’s ST-506 outright for $50 million and acquired 4E Therapeutics. Three of those four are neurology, which is the smallest of its four therapy areas at $429 million.
- Abbisko development and commercialisation licence USD 1.9B total
- BioArctic neurodegeneration programme USD 30M up, USD 800M total
- Sangamo ST-506 product purchase, neurology USD 50M
- 4E Therapeutics acquired, neurology, terms not disclosed
- Acquired IPR&D USD 2,776M against USD 154M, worth USD 3.03 a share
- Research and development USD 3.82B, up 14.5%, 16.6% of sales from 21.4%
- Marketing, selling, admin USD 3.43B, up 24.6%, 14.9% of sales
- Operating income USD 8.98B, up 30.7%, a 39.1% margin
- WatchEPS range top cut to USD 36.50 while the revenue range rose USD 3B
- WatchConcentration Mounjaro and Zepbound are 64.7% of sales
- WatchNeurology four deals in fifteen days, against a USD 429M therapy area
- WatchTax rate 23.3% against 16.5%, seven points of earnings drag
The Top Line · Q2 2026
 Beat · guidance raised
One franchise grew by more than the company’s biggest loss of exclusivity took away
J&J passed $25 billion in a quarter for the first time in its 140-year history, and the number that explains it is not the headline. It is STELARA, down 55.2 percent to $740 million from $1,653 million. The product shed $913 million of quarterly revenue against the same period last year, a hole close to a billion dollars wide in a single line item.
Oncology filled it and then some. The franchise grew 17.3 percent to $7,406 million, adding $1,094 million year on year, more than STELARA lost. That is the entire loss-of-exclusivity defence in two figures, and it is why guidance went up rather than sideways. Look one level further and the scale of the shift is clearer still: DARZALEX alone, at $4,207 million, is now larger than J&J’s whole Immunology therapy area at $3,844 million. A single product has outgrown a franchise.
Immunology still fell 3.7 percent, which is the honest counterweight. TREMFYA at $2,046 million is growing 72.5 percent and carrying the segment, but not yet fast enough to absorb what STELARA is giving up. The successor was in market before the cliff arrived, which is the part of the playbook J&J executed correctly; the arithmetic simply has not caught up yet.
The deal sheet says the same thing. J&J paid $1,000 million for Firefly Bio in June to buy a degrader antibody conjugate platform for Oncology, and in April sold botaretigene sparoparvovec back to MeiraGTx for $25 million upfront against $75 million total. A billion dollars into oncology chemistry, an ophthalmic gene therapy on the way out.
- TREMFYA FDA label expansion, structural joint damage in psoriatic arthritis
- CAPLYTA sNDA approved, relapse prevention in schizophrenia
- TECVAYLI positive CHMP with daratumumab in r/r myeloma
- ETHICON 4000 stapler CE mark, EU
- Firefly Bio acquired, degrader antibody conjugate platform USD 1B
- MeiraGTx buys Janssen bota-vec, ophthalmic gene therapy USD 25M up, USD 75M total
- DePuy Synthes licenses MinMaxMedical Gemtrack, musculoskeletal
- CG Bio NOVOSIS co-promotion with DePuy Synthes
- FDA decisionIMAAVY in wAIHA, no approved therapy exists today
- ReadoutRYBREVANT FASPRO head and neck cancer
- ReadoutERLEADA Ph3, prostate cancer surgery risk
- CorporateOrthopaedics separation removes a USD 2.4B-a-quarter business
The Top Line · Q2 2026
 Beat · Humira base shrinking
Skyrizi added more in one quarter than Humira has left to sell
Skyrizi reached $5,505 million, up 24.4 percent, which means it added roughly $1,080 million of revenue against the same quarter last year. Humira sold $756 million in the entire quarter. The successor is now adding more every three months than the predecessor has left to lose, and that is the cleanest statement of where AbbVie stands after the biggest patent cliff in the industry’s history.
Humira fell 35.9 percent and shed about $423 million. Immunology absorbed it and grew 15.1 percent to $8,786 million, with Rinvoq adding a further 24.5 percent to $2,525 million. Between them Skyrizi and Rinvoq are $8,030 million, which is 47.3 percent of everything AbbVie sold in the quarter and more than ten times what Humira now contributes.
Oncology is the exception, down 1.5 percent to $1,650 million as Imbruvica fell 29.4 percent to $532 million. AbbVie’s answer was to buy elsewhere: $10,900 million for Apogee Therapeutics in dermatology in June, an option over Kestrel Therapeutics worth up to $1,450 million in oncology, and a pain licence from Haisco. The Apogee price is more than fourteen times what Humira sold in the quarter.
Reported earnings tell a different story from adjusted. Diluted EPS was $2.03 against $0.52, but adjusted EPS was $3.65, up 22.9 percent. The gap is $1,689 million of intangible amortisation and $1,518 million from a change in fair value of contingent consideration, and the effective tax rate fell to 15.5 percent from 39.4 percent.
- Apogee Therapeutics acquired, dermatology USD 10.9B
- Kestrel Therapeutics option to acquire, oncology USD 1.45B total
- Haisco pain therapies licence USD 30M up, USD 745M total
- Seoul National University Hospital research collaboration, oncology
- Intangible amortisation USD 1,689M, the largest reconciling item
- Contingent consideration USD 1,518M from a change in fair value
- Effective tax rate 15.5% against 39.4% a year ago
- Diluted EPS USD 2.03 reported against USD 3.65 adjusted
- WatchOncology down 1.5%, the only franchise going backwards
- WatchImbruvica down 29.4% to USD 532M and still eroding
- WatchApogee USD 10.9B spent in dermatology, not oncology
- WatchHumira USD 756M left, below what Skyrizi adds in a quarter
The Top Line · Q2 2026
 Sales +5% · pre-tax loss
Keytruda stopped growing and its own subcutaneous version covered the gap
Keytruda sold $7,904 million against $7,956 million a year earlier. The biggest medicine in the world went backwards, by 0.65 percent. What closed the gap was Keytruda Qlex, the subcutaneous formulation, which took $463 million from nothing a year ago. Together they are $8,367 million, up 5.2 percent, and 50.4 percent of everything MSD sold.
Three products that barely existed twelve months ago added $919 million between them: Qlex $463 million, Winrevair $252 million as it grew 75 percent to $588 million, and Ohtuvayre $204 million from zero. MSD added $801 million in total, so everything else in the portfolio net shrank by $118 million.
The erosion is concentrated and old. Januvia and Janumet fell 31 percent to $429 million combined, shedding $194 million. Lagevrio is effectively finished at $5 million against $83 million. Dificid fell 77 percent and Vaxneuvance 35 percent. Against that, Prevymis grew 29 percent, Welireg 67 percent and Capvaxive 43 percent.
The bottom line went the other way entirely. MSD recorded a pre-tax loss of USD 683M against income of USD 4,999M, and a net loss of USD 1,335M against earnings of USD 4,427M. Research and development was USD 9,741M against USD 4,048M, 58.7 percent of sales, because two acquisitions were booked straight to R&D as asset acquisitions: Terns at USD 5.7B this quarter and Cidara at USD 9.0B in the first, USD 13.8B across the half.
- LIPFENDRA FDA approval, first and only oral PCSK9 inhibitor
- KEYTRUDA and QLEX FDA approval with WELIREG in adjuvant clear cell renal cell carcinoma
- KEYTRUDA and QLEX FDA approval with Trodelvy in first-line PD-L1 positive TNBC
- calderasib FDA Breakthrough Therapy designation, KRAS G12C with KEYTRUDA
- Protillion Biosciences development and commercialisation deal USD 510M total
- Adcendo ApS clinical trial agreement
- Exelixis clinical trial agreement, zanzalintinib
- Degron Therapeutics research partnership, molecular glue degraders
- PDUFAifinatamab deruxtecan under FDA review, decision date 10 October 2026, with Daiichi Sankyo
- Readoutsac-TMT positive topline in advanced or recurrent endometrial cancer
- Readouttulisokibart positive topline, Phase 3 ATLAS-UC induction study
- WatchKeytruda Qlex conversion rate ahead of the 2028 base patent expiry
The Top Line · Q2 2026
 CER +6% · reported -2%
The Swiss franc took away more than the business added
Roche’s underlying business grew 6 percent at constant exchange rates, worth about CHF 1,857 million. Currency cost it CHF 2,437 million. Reported sales therefore fell 2 percent to CHF 30,364 million while the same half, measured in dollars, grew 8 percent. Every headline on this card moves in opposite directions depending on which currency you read it in.
The pattern repeats down the statement. Core operating profit rose 10 percent at CER and fell 1 percent in francs to CHF 11,856 million. Core earnings per share rose 9 percent at CER and fell 2 percent in francs to CHF 10.85. IFRS operating profit rose 6 percent at CER and fell 6 percent in francs. The business improved its core operating margin to 39.0 percent from 38.8 percent and still reported lower profit.
Cash conversion is where the improvement shows without translation noise. Free cash flow rose 26 percent in francs to CHF 4,197 million, and 58 percent at constant rates, taking it from 10.7 percent of sales to 13.8 percent. Research and development fell 5 percent to CHF 5,765 million, or 19.0 percent of sales from 19.6 percent.
Pharmaceuticals grew 6.2 percent at CER to CHF 23,629 million with a core operating margin of 53.0 percent. Diagnostics grew 3.4 percent to CHF 6,735 million but its margin fell to 17.5 percent from 18.0 percent, held back by Near Patient Care, down 5 percent, and Asia-Pacific, down 5 percent. Net debt rose 37 percent to CHF 22,071 million.
- Pharmaceuticals 53.0% against 52.2%, sales up 6.2% at CER
- Diagnostics 17.5% against 18.0%, sales up 3.4% at CER
- Group 39.0% against 38.8%, sales up 5.6% at CER
- Net debt CHF 22.07B against CHF 16.16B at December, up 37%
- Europe, Middle East, Africa CHF 2.47B, 36.6% of the division, up 3% at CER
- North America CHF 2.21B, 32.8%, up 8% at CER
- Asia-Pacific CHF 1.52B, 22.6%, down 5% at CER
- Latin America CHF 536M, 8.0%, up 10% at CER
- WatchThe franc an 8 point gap between CER and reported growth
- WatchNear Patient Care down 5% at CER, the only shrinking Diagnostics area
- WatchNet debt up 37% to CHF 22.07B in six months
- WatchPharma growth 6.2% at CER against 9.6% in the same half last year
The Top Line · Q2 2026
 Sales up · net income down 19%
Oncology added $1,162 million and Entresto took away $1,176 million
Entresto lost more than half its revenue in a quarter, falling 50 percent to $1,181 million from $2,357 million. That is $1,176 million gone from a single brand, and it dragged the whole cardiovascular, renal and metabolic area down 36 percent to $1,688 million.
Oncology grew 35 percent to $4,515 million and added $1,162 million. Put the two side by side and the quarter explains itself: the biggest engine grew by $14 million less than the biggest loss took away. Net sales rose 1 percent at constant currency and 3 percent as reported, which is the whole story in one line.
Underneath, the compounding is real. Kisqali reached $1,695 million, up 44 percent, Kesimpta $1,424 million, up 32 percent, and Scemblix $562 million, up 89 percent. Cosentyx is still the largest brand at $1,824 million. What Novartis does not yet have is one of these at Entresto’s old scale.
Profit fell much harder than sales. Net income dropped 19 percent to $3,257 million while sales rose, and the two reasons are below the operating line: interest expense went from $289 million to $462 million, and the effective tax rate went from 11.2 percent to 23.7 percent. Core earnings per share, which strips those out, was flat at $2.41.
- Cosentyx FDA approval, juvenile ankylosing spondylitis
- Fabhalta FDA approval, IgA nephropathy
- Itvisma EU approval, intrathecal onasemnogene for spinal muscular atrophy
- Rhapsido EU and Japan approval, chronic spontaneous urticaria
- Antares Therapeutics research partnership with licence option, oncology USD 105M up, USD 1.91B total
- Orionis Biosciences development and commercialisation licence USD 40M up, USD 1.44B total
- SubmissionKPE179 del-zota, accelerated approval filing in Duchenne muscular dystrophy
- DecisionPluvicto metastatic hormone-sensitive prostate cancer, US and Japan
- DecisionVAY736 ianalumab in Sjögren’s disease, US, EU and Japan
- DecisionCosentyx polymyalgia rheumatica, US, EU and Japan
The Top Line · Q2 2026
 Core +21% · reported profit down
Oncology added more revenue than the whole company did
AstraZeneca added $871 million of revenue in the quarter. Oncology on its own added $1,011 million, growing 16 percent to $7,327 million. The arithmetic only closes one way: everything outside Oncology shrank by $140 million, and Oncology is now 48 percent of the company.
The drag is named and known. Cardiovascular, Renal and Metabolism fell 15 percent to $2,772 million as Farxiga lost US exclusivity, shedding about $489 million. China fell 7 percent to $1,587 million under volume-based procurement, and 13 percent at constant currency. Against that, Respiratory and Immunology grew 13 percent and Rare Disease 9 percent.
The gap between reported and core is the widest in this edition. Reported operating profit fell 10 percent to $3,164 million and reported operating margin dropped 4 points to 21 percent. Core operating profit rose 12 percent to $5,158 million with the margin up 2 points to 34 percent. Thirteen points separate the two margins, and reported EPS of $1.61 sits against core EPS of $2.63.
The pipeline delivered and disappointed in the same quarter. Imfinzi met its primary endpoint in VOLGA and NILE and missed in EMERALD-2. Wainua missed in CARDIO-TTRansform in ATTR-CM, and Ultomiris missed in HSCT-TMA. On the other side, Baxfendy took a first US approval in hypertension and Enhertu cleared three separate label expansions.
- Baxfendy first US approval, hypertension, BaxHTN
- Enhertu three US and EU expansions across HER2+ breast and solid tumours
- Truqap US approval, PTEN-deficient mHSPC
- Fasenra hypereosinophilic syndrome, US, EU, Japan and China
- Nucs AI research partnership, AI-driven imaging in oncology
- Owkin contract service agreement
- YMCA contract service agreement, oncology
- Filedtozorakimab COPD, EU and China
- FiledUltomiris IgA nephropathy, US and Japan
- FiledBaxfendy hypertension, Japan
- Filedefzimfotase alfa hypophosphatasia, Japan
The Top Line · Q2 2026
 Beat · costs held flat
Revenue rose $875 million and operating costs rose $17 million
Amgen added $875 million of revenue in the quarter and $17 million of operating cost. Total operating expenses were $6,540 million against $6,523 million a year earlier, which means 98 percent of the revenue increase fell straight to operating income. Operating income rose $858 million to $3,514 million.
Cost of sales did the work. It fell to $2,811 million from $3,011 million even as product sales grew 8.7 percent, taking gross margin to 72.0 percent from 67.2 percent, a gain of 484 basis points. Research and development still rose 7.1 percent to $1,868 million, so the saving is manufacturing and mix rather than restraint on the pipeline.
Six products carry roughly 70 percent of product sales and all six are compounding: Tezspire up 42 percent, Evenity 38 percent, Repatha 37 percent, biosimilars 29 percent, rare disease 21 percent and innovative oncology 18 percent. Amgen also disclosed free cash flow of $3.5 billion and capital expenditure of $0.5 billion.
Reported and adjusted earnings moved in opposite directions, and the reported number is the flattering one for once. GAAP diluted EPS was $4.37 against $2.65, up 65 percent, while non-GAAP EPS rose 4 percent to $6.29. Prior-year GAAP was held down by $394 million of other expense and a tax rate of 8.7 percent; this quarter the tax rate was 14.2 percent.
- Uplizna EU approval, generalised myasthenia gravis
- Imdelltra approvals and label updates in EU, China and Japan
- Repatha positive CHMP opinion, primary prevention
- Imdelltra EU approval, second-line extensive-stage small cell lung cancer
- Zai Lab clinical trial agreement, zocilurtatug pelitecan in oncology
- Free cash flow USD 3.5B in the quarter against USD 0.5B of capital expenditure
- Phase 3MariTide three type 2 diabetes studies plus switching and maintenance extensions
- Phase 3Uplizna chronic inflammatory demyelinating polyneuropathy, H2 2026 to H1 2027
- CompletionDazodalibep two Phase 3 Sjögren’s disease studies, H2
- CompletionTezspire Phase 3 eosinophilic oesophagitis, H2
The Top Line · Q2 2026
 Sales +2% · profit -19%
Sales rose 1.6 billion kroner and research spending rose 6.1 billion
Novo Nordisk added DKK 1,631 million of sales in the quarter and DKK 6,097 million of research and development. R&D rose 52 percent to DKK 17,787 million, which is 3.7 times the increase in sales, and took research to 22.7 percent of revenue from 15.2 percent.
Cost of goods sold moved the same way, up 33 percent to DKK 17,100 million against sales up 2 percent. Gross margin fell 507 basis points to 78.2 percent. Operating profit dropped 19 percent to DKK 27,061 million and the operating margin fell from 43.5 percent to 34.5 percent. Net profit fell 21 percent and diluted earnings per share went from DKK 5.96 to DKK 4.75.
The Rare disease segment turned loss-making. Sales were flat at DKK 4,907 million and it recorded an operating loss of DKK 1,295 million against a profit of DKK 518 million a year earlier, a margin of minus 26.4 percent. Obesity and Diabetes care grew 2.3 percent to DKK 73,581 million with its own operating margin down from 45.8 percent to 38.5 percent.
Commercially the launches are landing. US Wegovy weekly prescriptions are around 575,000 with the oral pill at roughly 265,000, the pill is now approved in the EU, UK and UAE, and Wegovy 7.2 mg launched in the UK. Novo holds a 58 percent GLP-1 volume share. Full-year adjusted guidance was still raised, to a range of 0 to minus 6 percent sales growth at constant currency.
- Wegovy 7.2 mg approved in the US, UK and EU, launched in the UK
- Wegovy pill approved in the UAE, UK and EU, launched in the UK and UAE
- Ozempic 2.0 mg launched in around ten countries
- Ten approvals more than ten regulatory approvals in the half
- Cellu development and commercialisation deal
- OpenAI contract service agreement
- Shantha Biologics contract service agreement
- H1 capital DKK 24.84B invested and DKK 35.31B paid in dividends
- GuidanceFull year adjusted sales growth of 0 to -6% at constant currency against +7% in the half
- ReadoutEtavopivat Phase 3 HIBISCUS successfully completed
- WatchRare disease operating loss of DKK 1.29B, first negative margin on the card
The Top Line · Q2 2026
 Sales +13% · net earnings -48%
Two thirds of the growth is a company Abbott did not own a year ago
Abbott’s reported revenue grew 13.0 percent. On a comparable basis it grew 4.8 percent. The 8.2 point gap is one line: Cancer Diagnostics contributed $919 million in the quarter and did not exist inside Abbott a year ago. Exact Sciences closed on 23 March 2026.
Of the $1,451 million Abbott added against the prior year, $919 million came from the acquisition and $532 million from everything it already owned. US Diagnostics grew 104.8 percent as reported and 4.0 percent on a comparable basis, which is the same arithmetic at segment level.
The rest of the portfolio is doing what it has been doing. Medical Devices grew 9.0 percent to $5,853 million and 8.4 percent comparable, the largest segment and the most consistent. Established Pharmaceuticals grew 8.4 percent to $1,499 million, entirely international. Nutrition is the only segment going backwards, down 3.1 percent to $2,144 million with US nutrition off 9.0 percent.
Earnings went the opposite way from sales. Operating earnings fell 17.5 percent to USD 1,693M and net earnings fell 47.8 percent to USD 928M. Three lines did it: selling and administrative costs rose USD 934M, intangible amortisation USD 238M, and interest expense USD 230M on the USD 19.8B of debt raised to buy Exact Sciences. Diluted EPS was USD 0.53 against USD 1.01.
- Exact Sciences acquisition closed 23 March 2026, now reported as Cancer Diagnostics
- Rapid Diagnostics aggregated with Molecular and Point of Care into one business in 2026
- Amplatzer Amulet moved from Structural Heart to Electrophysiology on 1 January 2026
- Multi-year agreement final Structural Heart compensation payment recognised in Q1 2026
- ALZpath development and commercialisation licence, in vitro diagnostics
- Exact Sciences contributed USD 919M of Q2 revenue in its first full quarter
- Base effectQ1 2027 first quarter where Exact Sciences sits in both years and the gap closes
- WatchNutrition US down 9.0%, the only segment shrinking
- WatchRapid and Molecular down 8.0% comparable on respiratory virus testing
The Top Line · Q2 2026
 Operating loss · USD 11.18B charge
The charge was larger than the quarter’s entire revenue
Gilead booked $11,183 million of acquired in-process research and development in a quarter that produced $7,803 million of revenue. Add $1,750 million of IPR&D impairments and the two lines together come to $12,933 million, which is 1.7 times everything the company sold. Total costs and expenses were $18,197 million against $4,608 million a year earlier.
The result is an operating loss of $10,394 million against operating income of $2,474 million, and an operating margin of minus 133.2 percent against plus 34.9 percent. Diluted loss per share was $8.45 against earnings of $1.56. The effective tax rate was minus 2.4 percent.
The trading business underneath is fine and rather dull by comparison. Product sales grew 8 percent to $7,627 million, and excluding Veklury they grew 10 percent to $7,604 million. HIV rose 12 percent to $5,693 million and is now 74.6 percent of product sales. Liver Disease grew 10 percent, Oncology 3 percent, and product gross margin improved 60 basis points to 79.3 percent.
The deal sheet does not fully account for the charge. Gilead acquired Tubulis on 7 April for $3,150 million upfront against $5,000 million total, and the remaining transactions on the sheet are contract service agreements with Tempus, Orsini, Yuhan and the WHO. What sits behind the balance of the $11,183 million is not in the extracted material.
- Tubulis acquired 7 April, antibody drug conjugates USD 3.15B up, USD 5B total
- Yuhan contract service agreement USD 139.8M
- Tempus contract service agreement
- Kite and Cencora contract service agreement
- HIV up 12% to USD 5.69B, now 74.6% of product sales
- Product sales ex-Veklury up 10% to USD 7.6B
- Veklury down 81% to USD 23M, effectively finished
- Dividend declared USD 0.82 a share against USD 0.79
- WatchThe charge whether more acquired IPR&D follows or this was a single event
- WatchSG&A up to 24.6% of revenue from 19.3%, the sharpest cost move on the card
- WatchOncology up only 3%, the slowest of the three named areas
The Top Line · Q2 2026
 Reported loss · adjusted EPS flat
Every dollar of revenue growth came from alliances and royalties
Pfizer’s revenue rose 3 percent to $15,034 million, and its product revenues fell 1 percent to $11,863 million. The $381 million the company added came from alliance revenues, up 19 percent to $2,697 million, and royalties, up 11 percent to $474 million. On the medicines it sells itself, Pfizer went backwards by $91 million.
Below the operating line the quarter turned. Other income and deductions net was $3,716 million against $739 million a year earlier, an increase of $2,977 million, which is nearly eight times the $381 million of revenue Pfizer added. Restructuring and acquisition costs added a further $457 million against a $18 million credit last year.
The result is a reported net loss of $248 million against net income of $2,910 million, and a loss per share of $0.04 against earnings of $0.51. Adjusted income was flat at $4,440 million and adjusted diluted EPS flat at $0.77. The effective tax rate on reported results was 62.4 percent against 4.6 percent.
Spending went the other way from sales. Research and development rose 13 percent to $2,809 million, taking R&D to 18.7 percent of revenue from 16.9 percent, while selling and administrative costs were held flat at $3,411 million. Pfizer also signed a development and commercialisation licence with Innovent Biologics worth $650 million upfront against $10,500 million in total.
- Innovent Biologics development and commercialisation licence USD 650M up, USD 10.5B total
- Arvinas development and commercialisation deal USD 70M up, USD 445M total
- Chai Discovery contract service agreement
- D&D Pharmatech contract service agreement
- SI&A expenses flat at USD 3.41B, down 1% operationally
- R&D expenses up 13% to USD 2.81B, the fastest cost line
- Cost of sales up to 27.2% of revenue from 25.8%
- Pfizer CentreOne up 7% to USD 373M, the contract manufacturing arm
- WatchProduct revenues whether the 1% decline is a base effect or a trend
- WatchOther deductions USD 3.72B against USD 739M, unexplained in the extract
- WatchH1 adjusted EPS USD 1.52 against USD 1.69, down 10%
The Top Line · Q2 2026
 Operating profit +48%
Operating profit rose 48 percent and gross profit rose 2.5 percent
Danaher’s operating profit rose 48.3 percent to $1,127 million on sales up 5.5 percent. Gross profit rose 2.5 percent. The gap between those two numbers is selling, general and administrative expense, which fell 12.2 percent, or $288 million, and did almost all the work.
Underneath, the margin went the wrong way. Cost of sales rose $241 million on sales up $329 million, so gross margin fell 171 basis points to 57.6 percent from 59.4 percent. Research and development rose only 2.2 percent to $412 million, taking R&D to 6.6 percent of sales from 6.8 percent.
Growth is less organic than the headline. Total sales growth of 5.5 percent breaks into 3.0 percent core, 1.5 points from acquisitions and 1.0 point from currency. Respiratory testing added a further 1.5 points, so core growth excluding respiratory was 4.5 percent. Diagnostics grew 7.0 percent in total and 2.0 percent core, with acquisitions worth 4 points.
Reported and adjusted earnings tell different stories. Diluted EPS rose 59.7 percent to $1.23 against a prior quarter depressed by impairments worth $0.60 a share. Adjusted diluted EPS rose 7.8 percent to $1.94, with acquisition amortisation of $0.65 a share the largest reconciling item.
- Total sales growth 5.5% reported
- Acquisitions 1.5 points of the 5.5
- Currency 1.0 point of the 5.5
- Core sales growth 3.0%, or 4.5% excluding respiratory testing
- Interest expense USD 107M against USD 71M
- Interest income USD 61M against USD 8M
- Effective tax rate 19.3% against 15.3%
- Diluted shares 707.6M against 719.1M, down 1.6%
- WatchGross margin down 171 basis points, the SG&A cut cannot repeat indefinitely
- WatchRespiratory testing worth 1.5 points of company growth and 3.0 points of Biotechnology
- WatchDiagnostics 7.0% total against 2.0% core, four points from acquisitions
The Top Line · Q2 2026
 H1 +20.7% · tax doubled
Pre-tax income rose $114 million and net income fell
Intuitive earned $1,054.6 million before tax in the quarter against $940.4 million in the first quarter, an increase of $114.2 million. Net income was $823.2 million against $826.0 million, a fall of $2.8 million. The entire difference is tax: the charge went from $114.4 million to $231.4 million, and the effective rate from 12.2 percent to 21.9 percent.
The trading business is compounding hard. Revenue rose 4.4 percent sequentially to $2,892.3 million and 20.7 percent year on year across the half to $5,663.1 million. All three lines grew together in the half: instruments and accessories up 20.4 percent, systems up 21.7 percent and services up 20.1 percent, which is the balance you want in a placed-base business.
Margins improved as volume scaled. Gross margin reached 67.8 percent against 66.1 percent in the first quarter, and 66.9 percent in the half against 65.5 percent, up 141 basis points. Cost of revenue actually fell in absolute terms quarter on quarter, to $931.9 million from $940.3 million, while revenue rose $121.5 million.
Investment is rising with it. Research and development was $370.6 million, 12.8 percent of revenue, and $732.5 million in the half, up 16.4 percent. Selling and administrative costs rose only 9.5 percent in the half against revenue up 20.7 percent, which is why half-year operating income rose 38.3 percent to $1,827.2 million.
- Gross margin 67.8% in the quarter, up 172 basis points on Q1
- Cost of revenue fell to USD 931.9M from USD 940.3M while revenue rose USD 121.5M
- Operating margin 33.6% against 30.9% in the first quarter
- Services the fastest sequential line at 8.9%
- Interest and other income USD 82.7M against USD 85.1M
- Effective tax rate 21.9% against 12.2%, and 17.3% in the half against 8.8%
- Excess tax benefits USD 17.3M against USD 73.3M in the first quarter
- Diluted shares 357.3M against 359.8M
- WatchTax rate whether 21.9% is the new run rate after two quarters of low single digits
- WatchSystems USD 685M placed in the quarter, the leading indicator for instrument revenue
- WatchR&D up 16.4% in the half, ahead of SG&A at 9.5%
The Top Line · Q2 2026
 Revenue +5.7% · EPS tripled
Earnings tripled because a charge did not repeat, not because the business tripled
Bristol Myers Squibb reported diluted earnings per share of USD 1.62 against USD 0.64, and net earnings of USD 3,317M against USD 1,310M. Revenue grew 5.7 percent. The gap between those two rates is one line that was there last year and is not there now: acquired IPR&D of USD 1,508M in the second quarter of 2025, the BioNTech upfront, against nil this quarter.
Underneath, the portfolio is turning over fast. The Growth Portfolio grew 14.6 percent to USD 7,560M, led by Camzyos up 60 percent, Breyanzi up 40.7 percent and Reblozyl up 29.4 percent. Cobenfy nearly doubled to USD 63M and Opdivo Qvantig, the subcutaneous version, reached USD 261M from USD 30M while base Opdivo fell 2.9 percent.
The Legacy Portfolio fell 4.4 percent to USD 5,422M, and inside it the erosion is severe. Pomalyst fell 71.2 percent to USD 204M and Revlimid 49.3 percent to USD 425M, shedding USD 917M between them. What held the line was Eliquis, up 21.8 percent to USD 4,481M and now the single largest product in the company, adding USD 801M on its own.
Costs moved the right way. Amortisation of acquired intangibles halved to USD 437M, restructuring reversed to a USD 32M credit, and the effective tax rate fell to 18.8 percent from 25.9 percent. Against that, research and development rose 14.7 percent to USD 2,959M, which is 22.8 percent of revenue, including USD 220M for a priority review voucher.
- ASCO data across the oncology franchise
- CELMoDs iberdomide and mezigdomide advancing toward commercialisation
- Iza-bren fourth global pivotal trial starting in 1L EGFR-mutant NSCLC
- Pumitamig Phase 2 combination study starting with imzokitug
- Acquired IPR&D nil this quarter against USD 1,508M last, the BioNTech upfront
- Intangible amortisation USD 437M against USD 830M, roughly halved
- Restructuring a USD 32M credit against a USD 279M charge
- Effective tax rate 18.8 percent against 25.9 percent
- PDUFAIberdomide FDA decision 17 August 2026 in relapsed refractory myeloma
- PaymentHengrui USD 600M upfront due in Q3 for thirteen early-stage assets
- PaymentBioNTech anniversary payments begin in Q3, USD 2.0B in aggregate to 2028
- WatchPomalyst down 71.2 percent, the steepest product decline in this edition
The Top Line · Q2 2026
 Beat · gross margin +450bp
Sales rose 9.4 percent and the cost of making them fell
Stryker sold $6,589 million, up 9.4 percent, and its cost of sales fell 4.1 percent to $2,091 million. Revenue up $567 million against cost down $90 million produced $657 million of extra gross profit, and gross margin jumped 450 basis points to 68.3 percent from 63.8 percent.
Operating expenses rose only $111 million against that. Research and engineering grew 6.6 percent to $434 million and selling and administrative costs 7.2 percent to $2,229 million, both slower than sales. Operating income therefore rose 49.1 percent to $1,659 million and the operating margin went from 18.5 percent to 25.2 percent.
The prior-year comparator flatters the picture slightly. Last year’s quarter carried $55 million of goodwill and other impairments against $1 million this year, and intangible amortisation fell from $187 million to $175 million. Neither explains a 450 basis point gross margin move, which is manufacturing and mix.
Below the line, tax took more. The effective rate rose to 18.4 percent from 13.0 percent, so net earnings grew 44.3 percent while pre-tax earnings grew 53.9 percent. Diluted earnings per share reached $3.30 against $2.29. Across the half, sales grew 6.1 percent and operating income 33.1 percent.
- Cost of sales fell 4.1 percent in absolute terms while sales rose 9.4 percent
- Impairments USD 1M this quarter against USD 55M a year ago
- Intangible amortisation USD 175M against USD 187M, down 6.4 percent
- Operating expenses up 4.1 percent, less than half the rate of sales
- Cash and equivalents USD 3.39B against USD 4.01B at December
- Inventories USD 5.52B against USD 5.31B
- Long-term debt USD 14.19B against USD 14.86B
- Shareholders’ equity USD 23.99B against USD 22.42B
- WatchGross margin whether 68.3 percent holds without the weak prior-year comparator
- WatchTax rate 18.4 percent against 13.0 percent, five points of earnings drag
- WatchInventories up USD 211M since December against a falling cost of sales
The Top Line · Q2 2026
 Revenue +13.7% · on a 14-week quarter
An extra week of selling sits inside a 13.7 percent growth rate
Medtronic’s revenue grew 13.7 percent to USD 9,756M, and the first thing to know about that number is that fiscal 2027 is a 53-week year with the extra week falling in this quarter. Against a 13-week comparative, roughly one fourteenth of the period had no counterpart a year ago. The reported rate flatters the underlying one by something close to seven points.
Even allowing for that, Cardiovascular is running hard. The segment grew 19.5 percent to USD 3,927M, and inside it Electrophysiology Therapies grew 29.6 percent to USD 2,218M, adding USD 506M. That single division is 22.7 percent of company revenue and produced 43 percent of the company’s growth.
The rest is steadier. Neuroscience grew 10.3 percent to USD 2,678M and Medical Surgical 9.9 percent to USD 2,279M, the segment that was flat in the United States a year ago. Diabetes, no longer a reportable segment since the MiniMed IPO in March, grew 16.9 percent to USD 843M and is still consolidated because Medtronic retains control.
Margins moved only slightly. Gross margin was 65.0 percent, unchanged, while operating profit rose 22.1 percent to USD 1,764M and the operating margin gained 124 basis points to 18.1 percent. Diluted earnings per share reached USD 1.14 against USD 0.81, helped by an effective tax rate of 16.3 percent against 19.6 percent.
- 53-week year fiscal 2027 carries an extra week, and it falls in this quarter
- Comparative the prior quarter ended 25 July 2025 and ran 13 weeks
- Fiscal calendar Medtronic’s year ends in late April, so this is fiscal Q1
- Segment recast Cardiovascular divisions renamed and prior periods restated this quarter
- CathWorks remaining shares acquired 20 April 2026 USD 718M
- Scientia Vascular acquired 12 June 2026, neurovascular access USD 681M
- SPR Therapeutics acquired 16 July 2026, peripheral nerve stimulation USD 654M
- Returned to holders USD 921M of dividends and USD 267M of buyback
- WatchUnderlying growth the first clean 13-week comparison since the extra week
- WatchMiniMed still consolidated after the March IPO, separation restructuring runs to FY29
- WatchNeuromodulation 4.9 percent, the slowest division in the company
The Top Line · Q2 2026
 Sales +17.8% at CER
Dupixent is 44 percent of the company and four fifths of its growth
Dupixent sold EUR 5,154M in the quarter, up 37.6 percent at constant rates, and is now 44.4 percent of everything Sanofi sells. Of the EUR 1,603M the company added year on year, Dupixent contributed roughly EUR 1,322M, which is 82 percent of the growth. Everything else in the portfolio added about EUR 281M between it.
In the United States the concentration is sharper still. Dupixent took €3,899 million there, growing 42.8 percent, against €6,344 million of total US sales. Three quarters of what Sanofi sells in its largest market is one molecule.
The launch cohort behind it is real but small. Pharma launches reached €1,305 million, up 48.3 percent, and including vaccines the launch portfolio was €1,530 million, up 61.1 percent. Ayvakit at €190 million and Wayrilz at €17 million are new to the table, and Sarclisa grew 35.7 percent to €187 million.
The erosion is spread thinly rather than concentrated. Influenza and COVID-19 vaccines fell 61.7 percent to €54 million, industrial sales fell 25.5 percent, Myozyme fell 22.9 percent and Lovenox 15.8 percent. Lantus, still €394 million, fell 7.0 percent and 17.1 percent in the United States.
- Pharma launches €1,305M, up 48.3 percent at constant rates
- All launches €1,530M including vaccines, up 61.1 percent
- Ayvakit €190M, new to the disclosure table
- Wayrilz €17M, entirely in the United States
- Qfitlia €7M from a standing start, all United States
- Beyfortus up 54.2 percent to €108M
- Dupixent up 37.6 percent, and 42.8 percent in the United States
- Sarclisa up 35.7 percent to €187M
- WatchDupixent concentration 44.4 percent of sales and 80 percent of growth
- WatchVaccines influenza and COVID-19 down 61.7 percent, the fastest decline on the card
- WatchEstablished portfolio Lantus, Lovenox, Plavix and Multaq all falling
The Top Line · Q2 2026
 Core +6% · total profit -76%
Core operating profit rose 6 percent and total operating profit fell 76 percent
On GSK’s core measure the quarter was strong: sales up 5 percent to £8,409 million, gross margin up 230 basis points to 77.4 percent, operating profit up 6 percent to £2,800 million and core earnings per share up 9 percent to 50.5 pence.
On the statutory measure it was not. Total operating profit was £481 million against £2,023 million, down 76 percent, and the total operating margin fell from 25.3 percent to 5.7 percent, a drop of 1,960 basis points. Total earnings per share fell 69 percent to 10.8 pence. The gap between the two measures is £2,319 million, and GSK attributes it principally to the impairment of camlipixant.
The underlying cost picture is genuinely improving. Cost of sales fell 4 percent to £1,898 million while sales rose 5 percent, which is what produced the 230 basis point gross margin gain, helped by product mix and an easy prior-year comparator. Selling and administrative costs rose 5 percent, in line with sales.
Research spending is going the other way on purpose. R&D rose 13 percent to £1,721 million, or 20.5 percent of sales, which GSK describes as accelerated pipeline investment. Royalties fell 17 percent to £204 million against a prior year that included an intellectual property settlement, and core EPS benefited from buybacks and a lower tax rate.
- Gross margin benefited from product mix and the prior-year comparator
- SG&A up 5 percent, driven by the phasing of spend
- R&D up 13 percent, accelerated pipeline investment
- Royalties down 17 percent against a 2025 intellectual property settlement
- Buyback share count reduction supporting core EPS
- Tax rate lower rate supporting core EPS
- Core EPS 50.5 pence against 46.5 pence, up 9 percent at both AER and CER
- Currency 0.2 points of drag on the core operating margin
- Watchcamlipixant the impairment behind a 1,960 basis point fall in total operating margin
- WatchR&D up 13 percent and costing 1.4 points of core margin
- WatchRoyalties down 17 percent, no longer flattered by a settlement
The Top Line · Q2 2026
 Beat · gross margin +306bp
Every region and every segment grew, and the smallest grew fastest
Boston Scientific grew 7.5 percent to $5,442 million, landing at the top of its own 5.5 to 7.5 percent guidance range. What is unusual is the spread: all four regions and both segments grew, and there is not a single declining line on the card.
Cardiovascular carried the volume, up 8.3 percent to $3,624 million, two thirds of the company. MedSurg grew 5.9 percent to $1,818 million, with Neuromodulation the fastest line anywhere in the business at 12.7 percent and Urology the slowest at 1.1 percent.
Geographically the smallest markets moved hardest. Latin America and Canada grew 21.9 percent to $206 million, and 16.2 percent operationally. Asia-Pacific grew 11.1 percent to $878 million. The United States, at $3,426 million and 63 percent of sales, grew 6.3 percent.
Margins did something unusual. Cost of products sold fell 2.6 percent to USD 1,594M while sales rose 7.5 percent, lifting gross margin 306 basis points to 70.7 percent. Operating expenses rose only 2.5 percent, so operating income climbed 43.8 percent to USD 1,178M and the operating margin gained 546 basis points to 21.7 percent. Reported diluted EPS was USD 0.61 against USD 0.53, and adjusted EPS USD 0.86.
- TruSelect 2.6 Microcatheter FDA 510(k) clearance, embolization portfolio
- FRACTURE trial met primary endpoints with the SEISMIQ 4CE system, presented at EuroPCR
- AVANT GUARD FARAPULSE pulsed field ablation in persistent atrial fibrillation, Heart Rhythm 2026
- ELEVATE-PF FARAFLEX mapping and ablation catheter feasibility study
- Penumbra agreed January 2026, thrombectomy, FTC second request pending, expected to close in H2 USD 14.5B
- MiRus LLC 33.75% non-voting equity plus an option over the TAVR business for a further USD 3B USD 1.5B
- Nalu Medical acquired 27 January 2026, chronic pain neuromodulation USD 523M
- Share repurchase USD 2B completed, about 40 million shares
- EnrollingFARADIGM pivotal trial of the FARAFLEX mapping and ablation catheter
- WatchUrology 1.1% growth, the slowest line in the business
- WatchLatin America, Canada 21.9% reported against 16.2% operational, a 5.7 point currency benefit
The Top Line · Q2 2026
 Life Science up · Healthcare down
Life Science grew 8 percent organically and Healthcare shrank 3.4 percent
The two sectors in scope went in opposite directions. Life Science grew 8.0 percent organically to €2,412 million, adding about €181 million. Healthcare shrank 3.4 percent organically to €2,151 million, losing roughly €72 million on the same basis. Together they are €4,563 million, 84 percent of the Merck Group.
Healthcare’s reported number only clears zero because of dealmaking. Acquisitions contributed 5.4 percentage points and currency 0.3, so a 3.4 percent organic decline became roughly 2.3 percent reported growth. Nothing about the trading business improved; the perimeter changed.
Inside Life Science the strength is concentrated. Process Solutions, 44 percent of the sector, grew 14.7 percent organically to €1,071 million. Discovery Solutions grew only 2.1 percent to €724 million and Advanced Solutions 4.4 percent to €617 million. One business unit is carrying the sector.
At group level, including Electronics which sits outside this scope, net sales were €5,434 million, up 3.4 percent, with organic growth of 4.1 percent. Profitability fell across the board: operating result was €753 million against €891 million, down 15.5 percent, and the margin dropped from 17.0 percent to 13.9 percent.
- In scope Healthcare €2,151M and Life Science €2,412M, 84 percent of the group
- Out of scope Electronics €871M, 16 percent of the group
- Combined in-scope sales €4,563M, derived by adding the two sectors
- Profit measures reported at group level only, so EBIT and EBITDA above include Electronics
- Process Solutions €1,071M, 44 percent of the sector, organic growth 14.7 percent
- Discovery Solutions €724M, 30 percent, organic growth 2.1 percent
- Advanced Solutions €617M, 26 percent, organic growth 4.4 percent
- Sector total €2,412M, organic growth 8.0 percent
- WatchHealthcare organic minus 3.4 percent, masked by a 5.4 point acquisition contribution
- WatchGroup EBIT margin 13.9 percent against 17.0 percent, down 310 basis points
- WatchDiscovery Solutions 2.1 percent organic, the slowest Life Science unit
The Top Line · Q2 2026
 Yen +10.2% · constant fx -0.5%
All of the growth was the yen, and net profit fell anyway
Takeda’s revenue rose 10.2 percent to ¥1,219.9 billion in yen and fell 0.5 percent at constant exchange rates. The underlying business shrank by about ¥5.5 billion and currency added roughly ¥118.7 billion. Every positive number on the top line is translation.
The pattern deepens down the statement. Operating profit rose 9.1 percent in yen and fell 3.1 percent at constant rates. Profit before tax rose 8.0 percent and fell 6.8 percent. By the time it reaches the bottom line even the yen cannot hold it up: net profit fell 8.9 percent to ¥113.3 billion, and 23.5 percent at constant rates.
Core measures are kinder but tell the same story. Core operating profit rose 11.5 percent in yen and fell 0.5 percent at constant rates, and core net profit rose 2.5 percent in yen against a 10.9 percent fall at constant rates. Core earnings per share were ¥154 against ¥151, up 1.5 percent reported and down 11.8 percent at constant rates.
This is the mirror image of Roche, five places above in this edition. Roche’s business grew 6 percent at constant rates and the Swiss franc turned it into a 2 percent decline. Takeda’s business shrank 0.5 percent at constant rates and the yen turned it into 10.2 percent growth. Neither number is wrong; they are answers to different questions.
- Revenue 10.7 points between +10.2 percent and -0.5 percent
- Operating profit 12.2 points between +9.1 percent and -3.1 percent
- Net profit 14.6 points between -8.9 percent and -23.5 percent
- Basic EPS 14.4 points between -9.8 percent and -24.2 percent
- Roche at 05 grew 6 percent at CER and reported a 2 percent decline in francs
- Takeda at 22 shrank 0.5 percent at CER and reported 10.2 percent growth in yen
- Same quarter opposite currency effects on two companies of similar shape
- Fiscal note Takeda’s year ends in March, so this is fiscal Q1 and the calendar period aligns
- WatchConstant currency revenue minus 0.5 percent, the underlying line the yen is masking
- WatchNet profit down 8.9 percent even in yen and 23.5 percent at constant rates
- WatchCore to reported gap core operating profit ¥358.9B against reported ¥201.4B
The Top Line · Q2 2026
 Volume +5.1% · price -4.3%
They sold 5 percent more and were paid 4 percent less for it
Bayer’s pharmaceuticals division sold 5.1 percent more by volume and took 4.3 percent less on price. Add currency at minus 0.7 and portfolio at minus 0.4 and sales landed at €4,458 million, down 0.3 percent reported and up 0.8 percent adjusted. The quarter is a volume story cancelled by a price story.
Geographically it is not one business but two. Europe, the Middle East and Africa fell 17.8 percent to €1,393 million, shedding €301 million. North America grew 20.8 percent to €1,640 million, adding €282 million. Those two moves are 38.6 percentage points apart and almost exactly cancel: the division net lost €12 million.
The product mix behind it is a straight handover. Nubeqa and Kerendia continued to post significant gains, with Nubeqa growing in every region and strongest in the United States and Europe, while Radiology and the Mirena family also grew. Against that, Bayer recorded substantially lower Eylea and Xarelto sales on patent expirations.
Research spending fell while capital spending rose. R&D was €837 million against €959 million, down 12.7 percent, and capital expenditure was €290 million against €182 million, up 59.3 percent. Operating cash flow at the division collapsed to €80 million from €493 million, and at group level free cash flow was minus €371 million against plus €125 million.
- Nubeqa significant gains in all regions, strongest in the United States and Europe
- Kerendia continued significant gains
- Radiology strong topline growth
- Mirena family strong topline growth
- Eylea substantially lower on patent expiration
- Xarelto substantially lower on patent expiration
- Price minus 4.3 percent across the division
- R&D down 12.7 percent to €837M
- WatchPrice minus 4.3 percent, cancelling a 5.1 percent volume gain
- WatchEMEA down 17.8 percent, the steepest regional decline in this edition
- WatchGroup free cash flow minus €371M in the quarter and minus €2,691M in the half
The Top Line · Q2 2026
 Orders +14% · revenue +2%
Orders grew seven times faster than revenue
Orders rose 14 percent to €6,860 million and revenue rose 2 percent to €5,764 million. That is a book-to-bill of 1.19, and it means the company took in €1,096 million more work than it converted in the quarter. On a comparable basis orders grew 15 percent against revenue at 3 percent.
Profit rose 28 percent to €1,047 million and the margin went from 14.5 percent to 18.2 percent, a gain of 370 basis points. Excluding severance the margin was 18.6 percent against 15.1 percent. Management attributes the increase primarily to positive effects from tariff refunds in the United States, which is a one-off rather than an operating gain.
The revenue split inside the business is uneven. Volume growth came from imaging and precision therapy. Diagnostics declined, which Siemens attributes in part to a structural change in the market environment in China rather than a trading effect it expects to reverse quickly.
Currency worked against the quarter throughout, and profit still rose in every business. Severance costs fell to €24 million from €31 million. Note the calendar: Siemens Healthineers reports on a September year end, so its fiscal third quarter is the calendar quarter to June and aligns with this edition.
- Imaging volume increase, and profit up most notably here
- Precision therapy volume increase, and profit up most notably here
- Orders 14 percent actual and 15 percent comparable
- Profit up in all businesses despite adverse currency
- Diagnostics revenue declined, in part on a structural change in the China market
- Revenue 2 percent actual against orders at 14 percent
- Currency adverse across the quarter
- Margin quality the 370 basis point gain is primarily US tariff refunds
- WatchTariff refunds the primary driver of a 370 basis point margin gain, and not repeatable
- WatchBacklog conversion book-to-bill of 1.19 has to turn into revenue
- WatchDiagnostics in China described as a structural market change
The Top Line · Q2 2026
 Revenue +5.4% · guidance updated
The United States grew twice as fast as everywhere else
BD grew 5.4 percent to $4,983 million, or 4.4 percent on a currency-neutral basis. The split by geography is the striking part: the United States grew 6.9 percent reported and currency-neutral alike, while International grew 3.2 percent reported and only 0.6 percent once currency is stripped out.
All four segments grew. BioPharma Systems led at 6.6 percent reported and 5.2 percent currency-neutral, with Interventional close behind at 6.4 and 5.5 percent. Medical Essentials, the largest, grew 4.5 percent reported but 3.2 percent currency-neutral, the slowest underlying line in the business.
Cost structure is that of a device manufacturer rather than a pharmaceutical company. Cost of products sold was $2,668 million, 53.5 percent of revenue, leaving a gross margin of 46.5 percent. Research and development was $258 million, or 5.2 percent of revenue, roughly a quarter of what the pharmaceutical names in this edition spend proportionally.
Earnings moved almost exactly with sales. Reported diluted EPS rose 4.5 percent and 3.8 percent currency-neutral; adjusted diluted EPS rose 4.9 percent and 3.9 percent. BD updated its full-year guidance alongside the result. Note the calendar: BD’s financial year ends in September, so its fiscal third quarter is the calendar quarter to June and aligns with this edition.
- Medical Essentials awarded a Vizient contract
- BioPharma Systems announced a collaboration
- Interventional launched the Elyra platform
- Recognition named to TIME’s list, and issued the fiscal year sustainability report
- United States 6.9 percent reported and 6.9 percent currency neutral
- International 3.2 percent reported and 0.6 percent currency neutral
- Total 5.4 percent reported and 4.4 percent currency neutral
- Guidance full-year outlook updated with the result
- WatchInternational 0.6 percent currency-neutral growth, the weakest line on the card
- WatchMedical Essentials largest segment, slowest underlying growth at 3.2 percent
- NoteFebruary 2026 a basis of presentation change is noted in the source and is not detailed here
The Top Line · Q2 2026
 Flat revenue · operating loss
The growth brands added exactly what generics lost, and the loss came from somewhere else
Teva’s three growth brands added USD 310M between them and generic products lost USD 308M. The two almost perfectly cancel, which is why revenue was flat at USD 4,142M against USD 4,176M, down 0.8 percent. AUSTEDO grew 39.8 percent to USD 696M, AJOVY 57.8 percent to USD 243M and UZEDY 42.6 percent to USD 77M, while generics fell 12.8 percent to USD 2,103M.
The loss came from research spending. R&D was USD 970M against USD 244M, a rise of USD 726M in a quarter where revenue fell USD 34M. That took R&D to 23.4 percent of revenue from 5.8 percent and turned an operating profit of USD 455M into an operating loss of USD 231M.
Everything between gross profit and operating income moved against the company at once. Legal settlements and loss contingencies rose to USD 230M from USD 166M, and selling and marketing to USD 717M from USD 654M. Gross margin actually improved 164 basis points to 52.0 percent, so the trading business was healthier and the result was still a loss.
Non-GAAP earnings tell the sharpest version. Non-GAAP net income attributable to Teva fell to USD 21M from USD 769M and non-GAAP diluted earnings per share to USD 0.02 from USD 0.66. Reported diluted loss per share was USD 0.49 against earnings of USD 0.24. Teva still raised full-year revenue guidance to USD 16.5 to 16.85B.
- AJOVY up 57.8 percent to USD 243M worldwide
- UZEDY up 42.6 percent to USD 77M
- AUSTEDO up 39.8 percent to USD 696M
- International Markets up 11.1 percent to USD 550M, the only segment growing
- Generic products down 12.8 percent to USD 2,103M worldwide
- United States segment down 4.7 percent, segment profit of -USD 76M
- Europe segment down 2.7 percent to USD 1,263M
- Non-GAAP net income USD 21M against USD 769M
- GuidanceRevenue raised to USD 16.5 to 16.85B from USD 16.4 to 16.8B
- GuidanceAUSTEDO raised to USD 2,450 to 2,600M
- GuidanceAJOVY raised to USD 850 to 870M from USD 750 to 790M
- WatchR&D whether USD 970M was a one-off charge or a new base
The Top Line · Q2 2026
 Sales +8% · +7% constant fx
Equipment is a sixth of surgical and produced half its growth
Alcon grew 8 percent to $2,782 million, and 7 percent at constant currency. Inside Surgical, which grew 8 percent to $1,570 million, the contributions are wildly uneven. Equipment and other grew 26 percent, adding $57 million, while Implantables grew 2 percent, adding $10 million. Equipment is 17.8 percent of the segment and delivered roughly half its growth.
Implantables is the line to watch. At $466 million it is the second largest in Surgical and grew just 1 percent at constant currency. Intraocular lenses grew 2 percent at constant currency on the strength of PanOptix Pro, and Alcon names two offsets explicitly: competitive pressures, and lower sales in surgical glaucoma.
Vision Care carried the other half of the company and grew 8 percent to $1,212 million, 7 percent at constant currency. Ocular health was the stronger line at 13 percent, reaching $486 million, against contact lenses at 5 percent and $726 million.
Across the half the pattern holds. Net sales were $5,467 million against $5,028 million, up 9 percent reported and 7 percent at constant currency, with a 2 point currency benefit. Equipment and other again led at 26 percent reported and 24 percent constant currency.
- Equipment and other 26 percent reported and 25 percent at constant currency
- Ocular health 13 percent reported and 12 percent at constant currency
- Consumables 6 percent reported and 5 percent at constant currency
- Contact lenses 5 percent reported and at constant currency
- Intraocular lenses up 2 percent at constant currency
- PanOptix Pro named as the driver of IOL growth
- Competitive pressures named by Alcon as an offset
- Surgical glaucoma lower sales, named as an offset
- WatchImplantables 1 percent constant currency, competitive pressure named explicitly
- WatchEquipment 26 percent growth on a small base, half of Surgical’s increase
- WatchCurrency 1 point of benefit in the quarter and 2 points in the half
The Top Line · Q2 2026
 Orders +11.1% · revenue +3.5%
Orders grew three times faster than revenue, and free cash flow was negative without tariff refunds
Organic orders grew 11.1 percent against organic revenue at 3.5 percent, a book-to-bill of 1.15 times and a backlog of $23.9 billion. Demand is running well ahead of what GE HealthCare is converting, which is the same signal Siemens Healthineers is showing four places above at 1.19 times.
The reported profitability is flattered. Free cash flow was $68 million, an improvement of $61 million, and GE HealthCare states it includes $107 million of refunds for IEEPA tariffs incurred in 2025 and 2026. Strip those out and cash flow for the quarter was negative by roughly $39 million.
The same qualifier runs through the margin. Adjusted EBIT was $750 million at a 14.2 percent margin, down 40 basis points, and includes $23 million of 2026 tariff refunds. Adjusted EPS of $1.13 was up 6.6 percent and includes $0.04 of the same benefit. The company also notes that both measures exclude a further $106 million and $0.18 of refunds relating to 2025 tariffs.
Strategically the quarter was about scale and consolidation. GE HealthCare signed a $500 million Care Alliance with Catholic Health, strengthened a theranostics collaboration in Germany, and reported Flyrcado on track for a $500 million annual opportunity with Vizamyl at $200 million by 2028. It is also consolidating a new AIS segment and Global Markets region.
- Catholic Health Care Alliance signed, about USD 500M across several care areas and services
- Theranostics collaboration strengthened with leading academic partners in Germany
- Flyrcado on track for a USD 500M annual opportunity by 2028
- Vizamyl on track for USD 200M by 2028
- Orders driven by commercial execution and adoption of new products across all segments and regions
- Gadolinium-free MR contrast Phase 2/3 progressing with high recruitment in the US and Europe
- Price and cost actions incremental measures beginning to take effect against inflation
- Segment change consolidating a new AIS segment and Global Markets region
- WatchFree cash flow negative by about USD 39M once tariff refunds are removed
- WatchBacklog conversion USD 23.9B and a book-to-bill of 1.15x to work through
- WatchAdjusted EBIT margin down 40 basis points even with USD 23M of refunds inside it
The Top Line · Q2 2026
 Margin +4.0pp on tariff refunds
The margin rose four points and Philips says the tariff refund was worth 4.2
Adjusted EBITA margin improved to 16.4 percent from 12.4 percent, a gain of four points. Philips states plainly that this includes a tariff refund benefit of effectively 4.2 percent, and that adjusted EBITA excluding the refund slightly decreased, held back by cost inflation and higher tariffs against higher sales and productivity measures. The entire improvement, and slightly more, is a refund.
Sales were €4,360 million, up 1 percent nominally and 4 percent on a comparable basis, with growth across all segments: Personal Health up 8 percent comparable, Diagnosis and Treatment up 2 percent and Connected Care up 2 percent. Comparable order intake, however, was minus 1 percent against plus 6 percent a year earlier.
That order number is the outlier in the medtech block. Siemens Healthineers is running a book-to-bill of 1.19 and GE HealthCare 1.15, both with backlogs building faster than revenue. Philips is the one taking in less work than a year ago.
Reported profit rose sharply for reasons beyond trading. Income from operations was €609 million against €400 million, helped by the refund, higher sales and a swing in restructuring and acquisition items from a €20 million charge to €86 million of income, which included a €99 million gain on a divested business against €50 million of portfolio realignment and €50 million of Respironics charges. Net income was €386 million against €240 million.
- Income from operations up €209M on the tariff refund, higher sales and lower restructuring charges
- Adjusted EBITA excluding the refund it slightly decreased on cost inflation and higher tariffs
- Restructuring and acquisition income of €86M against charges of €20M a year ago
- Income tax expense up €65M, including the tax impact of the divestment
- Divestment gain €99M on the sale of a divested business
- Portfolio realignment €50M of charges
- Respironics €50M of related charges
- Net effect a €106M swing against the prior-year quarter
- WatchOrder intake minus 1 percent comparable, against +6 percent a year ago
- WatchUnderlying margin adjusted EBITA excluding the refund slightly decreased
- WatchTariffs higher tariffs named as a headwind alongside the refund benefit
The Top Line · Q2 2026
 Sales +5% · adjusted EPS flat
Most of the earnings increase is a smaller loss from a business being exited
Net income rose 38 percent to $126 million from $91 million. Income from continuing operations rose 11 percent, contributing $13 million. The loss from discontinued operations narrowed from $31 million to $9 million, contributing $22 million. Roughly 63 percent of the earnings increase comes from a business Baxter is on the way out of.
On the continuing business the picture is flat. Sales grew 5 percent to $2,960 million while cost of sales grew 6 percent, so gross margin slipped 40 basis points to 34.9 percent, the lowest on any card in this edition. Adjusted operating income was $421 million against $423 million, unchanged, and adjusted diluted EPS from continuing operations fell 5 percent to $0.56.
The costs Baxter did control were the discretionary ones. Selling and administrative expenses grew 2 percent, well below sales, taking them to 24.8 percent of revenue from 25.6 percent. Research and development fell 4 percent to $129 million, or 4.4 percent of sales from 4.8 percent, which is the lowest research intensity in this edition.
Below the line, both interest and tax took more. Net interest expense rose 10 percent to $64 million and the effective tax rate rose to 14.6 percent from 8.3 percent. Reported operating income still grew 14 percent to $217 million, taking the operating margin from 6.8 percent to 7.3 percent.
- Net sales up 5 percent to USD 2.96B
- Operating income up 14 percent to USD 217M, margin 7.3 percent from 6.8 percent
- Income before taxes up 19 percent to USD 158M
- Reported diluted EPS USD 0.24 against USD 0.18, up 33 percent
- Gross margin 34.9 percent from 35.3 percent, cost of sales up 6 percent
- Research and development down 4 percent to USD 129M
- Adjusted EPS from continuing operations USD 0.56 against USD 0.59, down 5 percent
- Adjusted operating income USD 421M against USD 423M, flat
- WatchDiscontinued operations the USD 22M swing that carried most of the earnings increase runs out
- WatchGross margin 34.9 percent and falling, cost of sales outgrowing sales
- WatchR&D cut 4 percent to 4.4 percent of sales, the lowest intensity in this edition
The Top Line · Q2 2026